Infographic: Humanitarian aid and trends in procurement
Aid International Development Forum (AIDF) has released an infographic (see below) that explores humanitarian aid and trends in procurement. Within disaster relief logistics, procurement accounts for 65 per vent of total expenditures by the UN organisations.
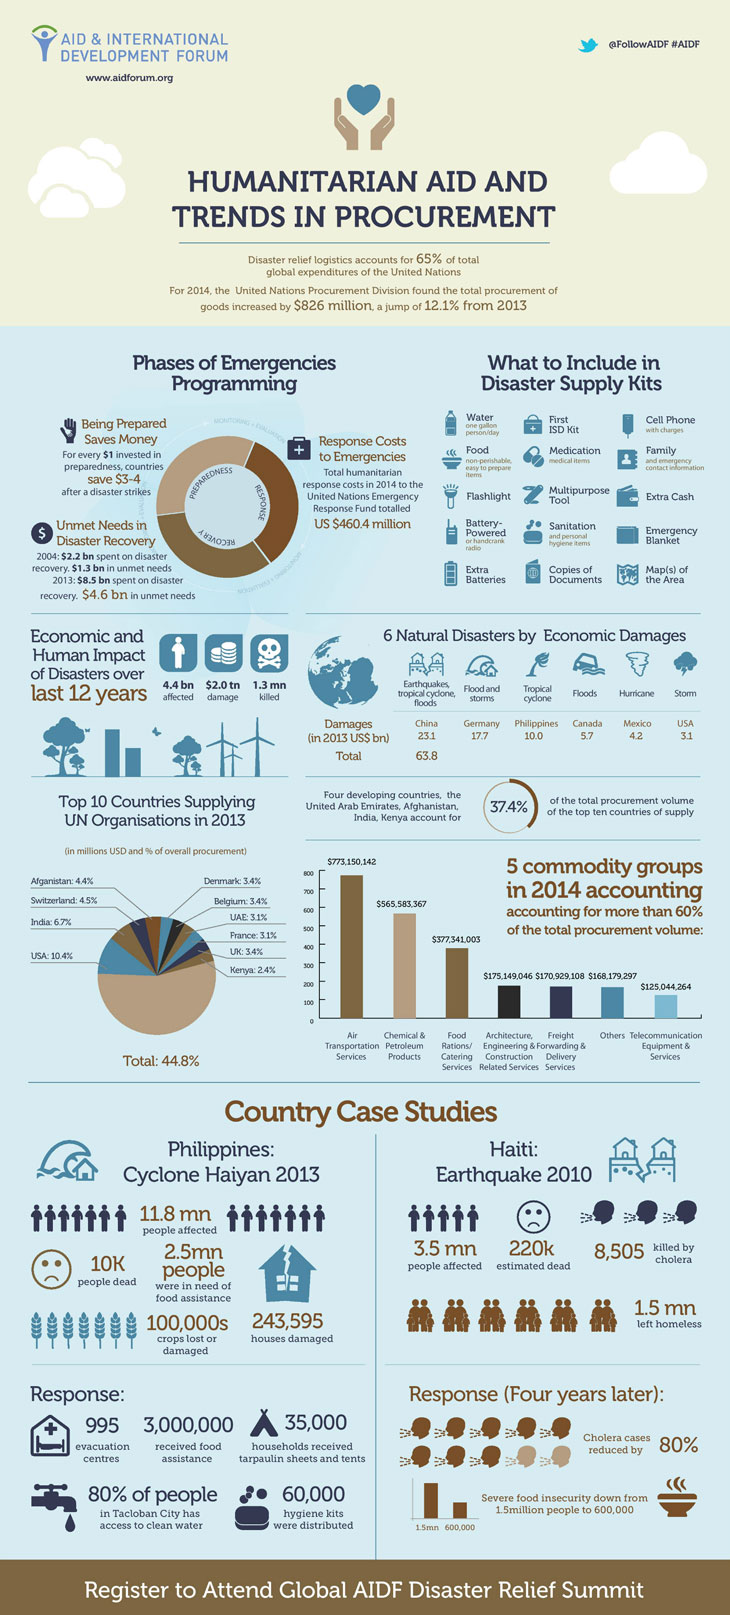
The latest figures released by the United Nations Procurement Division found the total procurement of goods increased by $826 million, a jump of 12.1 per cent. This reflects a stark trend: the last decade has seen a sharp increase in the number of natural disasters across the world.
The infographic is a timely release for AIDF’s upcoming 7th Global Disaster Relief Summit in Washington DC on September 10-11, at which CRJ is a media partner. AIDF’s work is premised on the belief that collaboration and partnerships across regions and sectors are key to developing more effective disaster response that will also protect each country’s progress towards sustainable development.
During the two-day summit, international experts will gather to discuss how technological innovations and best practices can assist in disaster response and aid delivery in more effective, sustainable and cost-efficient way. AIDF has developed the agenda in consultation with key organisations, such as UNOCHA, World Vision, UNOPS, USAID, Red Cross, World Bank, Aidmatrix, and CIPS.
The infographic provides a snapshot into this reality. Total humanitarian response to the United Nations Emergency Response Fund totalled US $460.4 million. The damages faced by countries, particularly those in disaster-prone areas, are extensive. For instance, China suffered through US $ 23.1 billion in damages caused by earthquakes, tropical cyclones and floods in one year alone.
More frequently, earthquakes, storms, tropical cyclones, floods, and hurricanes are the major causes for these severe damages and loss of life for countries affected by natural disasters. Nepal’s earthquake and Vanuatu’s Cyclone Pam are two devastating disasters this year that have required major international response.
Case studies focusing on Cyclone Haiyan that struck the Philippines in 2013 and Haiti’s earthquake in 2010 illustrate the kind of humanitarian crises caused by disasters; the infographic looks at the number of people affected, killed, made homeless, and at risk because of food shortages and spread of disease. The infographic shows how humanitarian aid is prioritised and allocated when responding to emergencies, to best cater for people’s immediate needs.
As a result, procurement is one of the most vital aspects to be able to effectively respond to emergencies.
The infographic details the top five commodity groups that accounted for more than 60 per cent of the total procurement volume last year. Significantly, air transportation tops this list, demonstrating the importance of transport in facilitating access to deliver services, whether for emergency or non-emergency situations.
Responding to these disasters requires preparedness. The infographic details the items that are essential in a disaster supply kit to cover protection, security and basic needs for individuals to survive through an emergency.
For more information and to register delegates can click here
[Humanitarian-Aid-Infographic-May-2015-page-001]